Agentless, cloud-native backup for Microsoft Azure
Post Reply
jorgedlcruz
Veeam Software
Posts: 1493
Liked: 655 times
Joined: Jul 17, 2015 6:54 pm
Full Name: Jorge de la Cruz
Contact:

Grafana Dashboard using the new RestAPI

Post by jorgedlcruz » 8 people like this post

Hi guys,
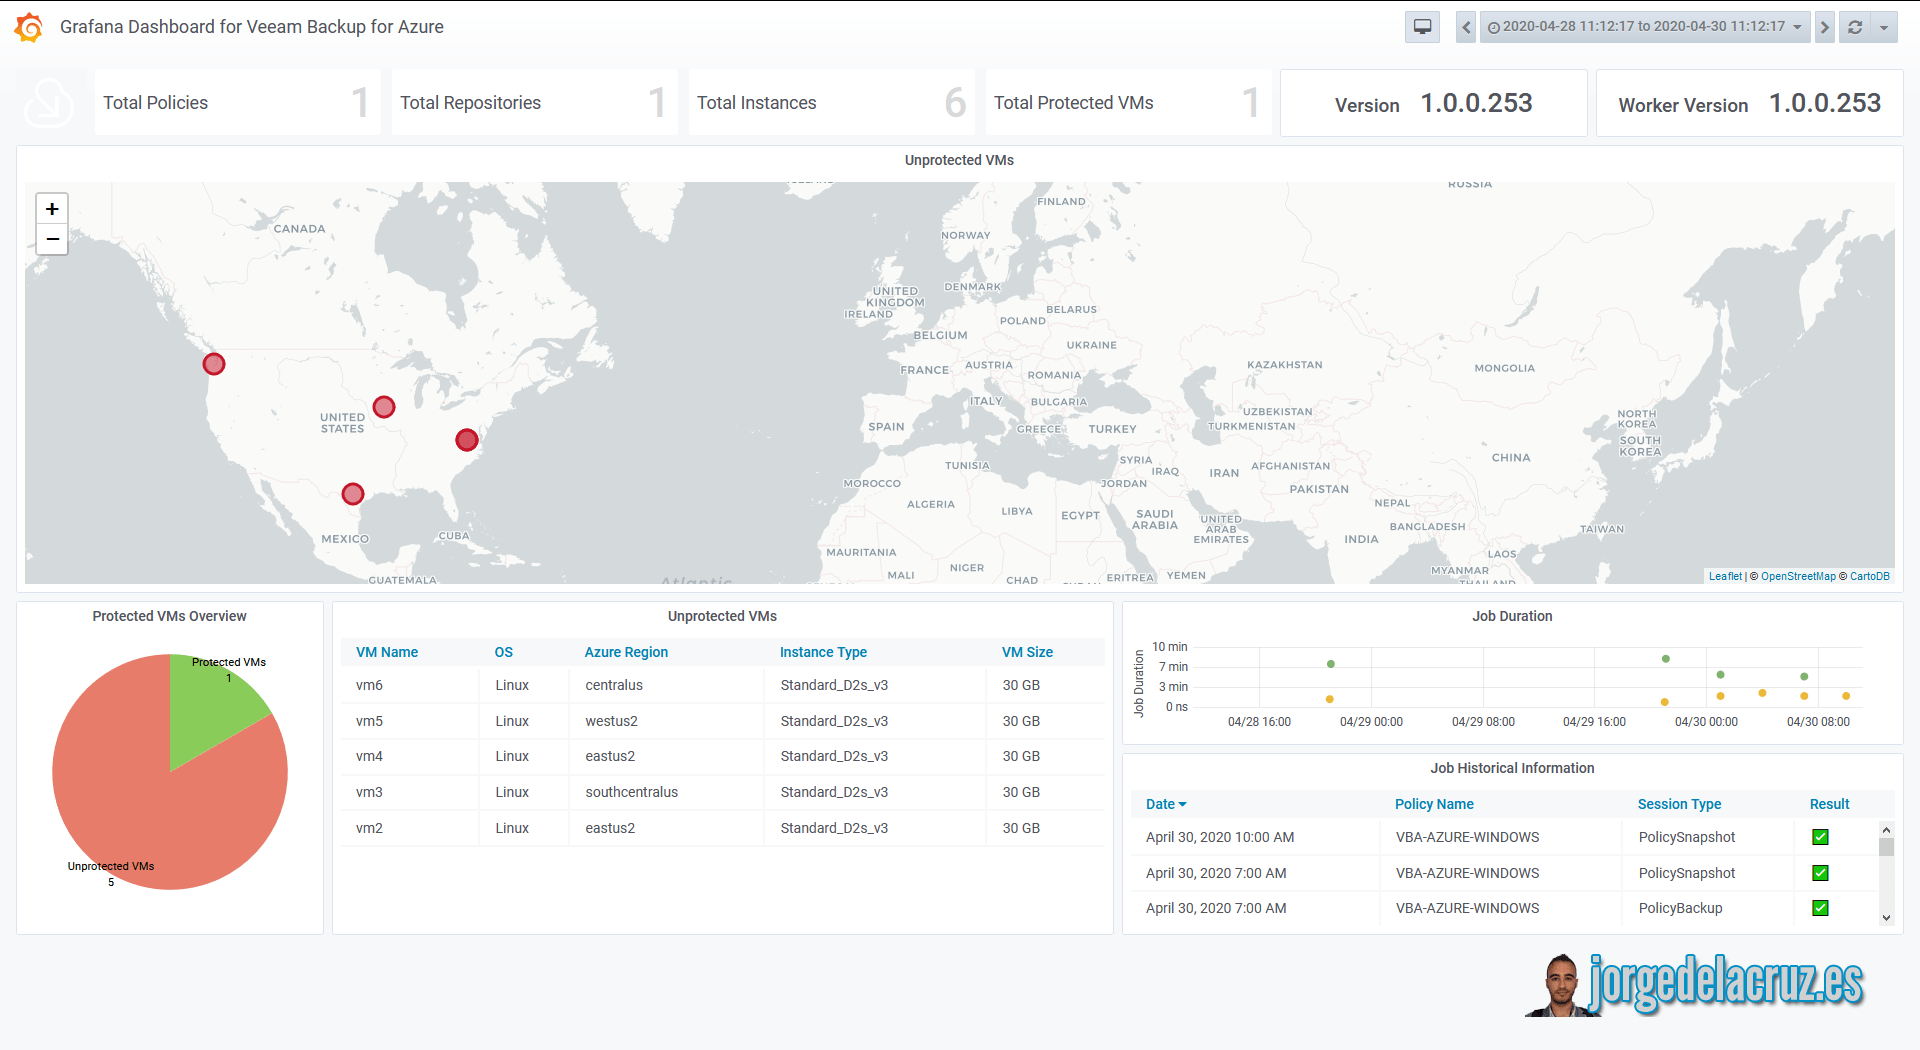
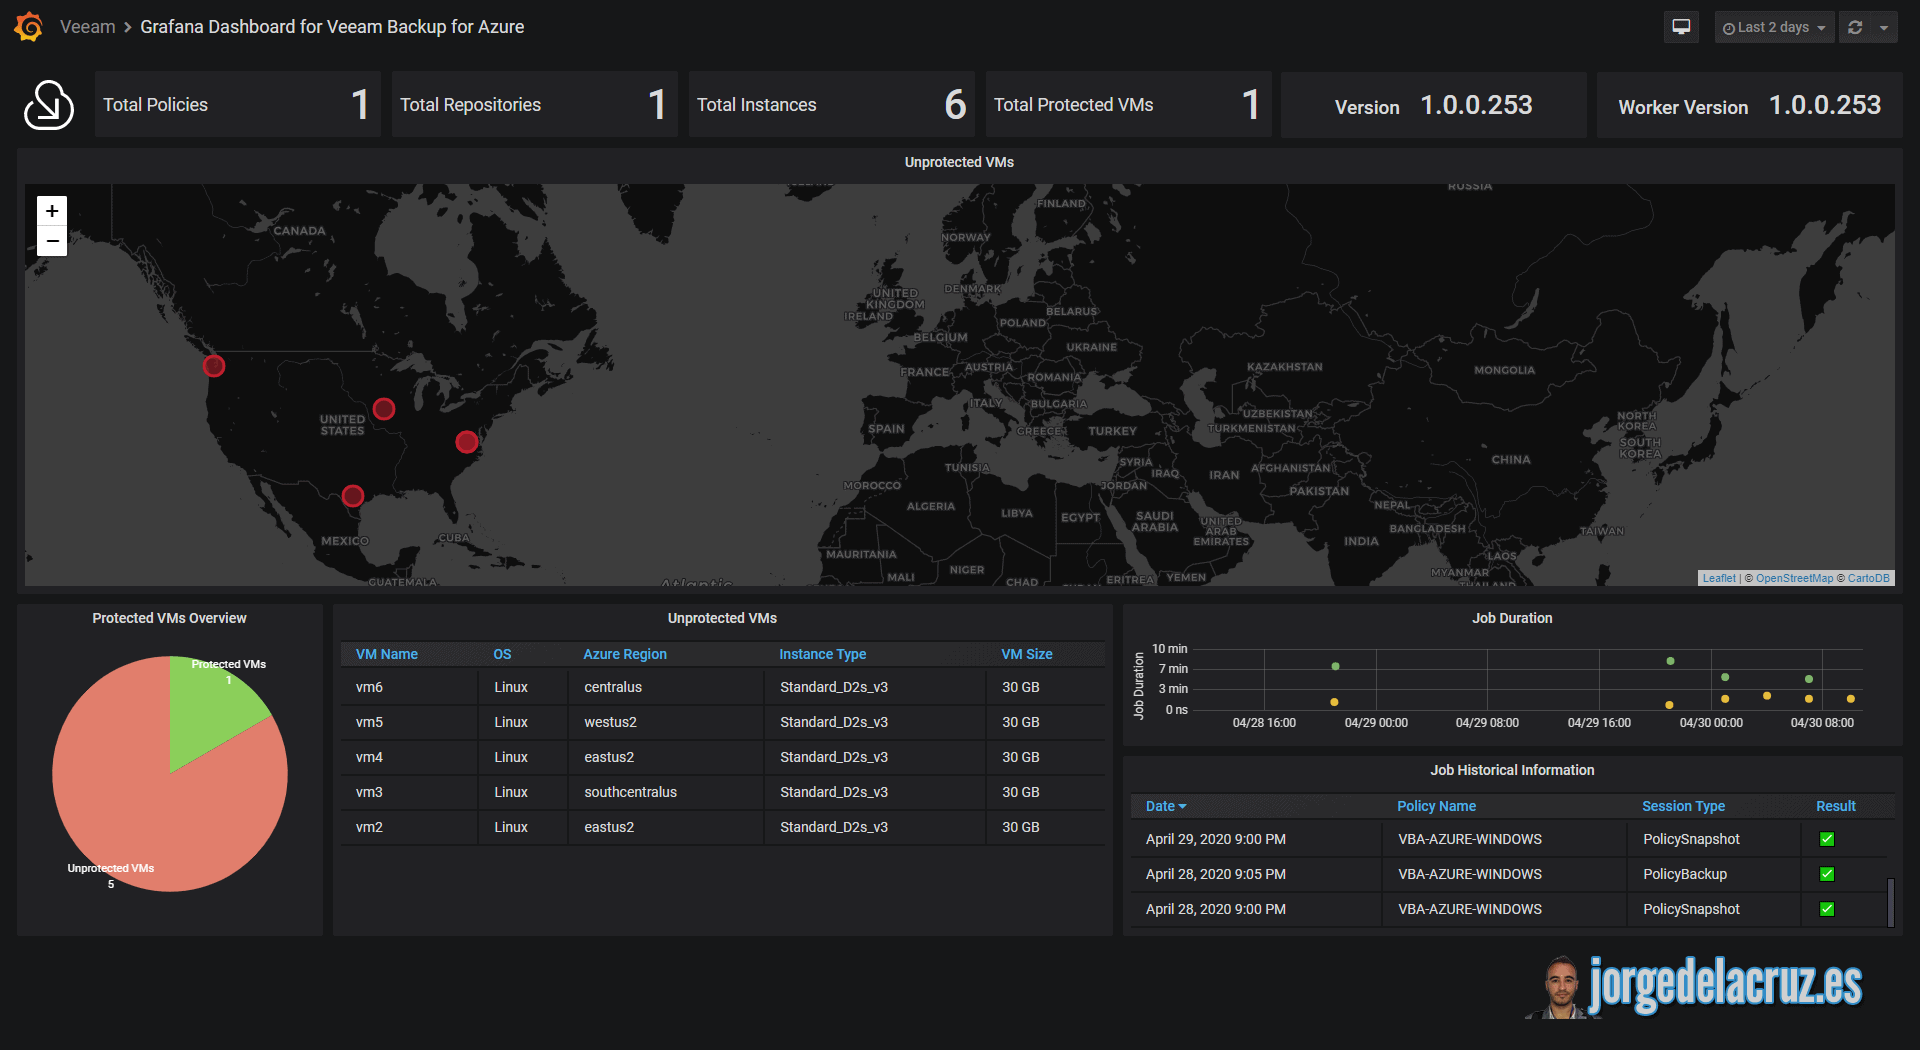
I'm glad to share this community project over here, by leveraging the really powerful new RESTful API that Veeam Backup for Microsoft Azure brings, I have built a quick bash script that pulls the data out, send it to InfluxDB, and from there it is presented in a gorgeous Grafana Dashboard, please take a quick look to this URL to see it in action: The step-by-step can be found here - https://jorgedelacruz.uk/2020/04/30/loo ... oft-azure/

And as a quick example in image, here:
Image
Image
Jorge de la Cruz
Senior Product Manager | Veeam ONE @ Veeam Software

@jorgedlcruz
https://www.jorgedelacruz.es / https://jorgedelacruz.uk
vExpert 2014-2024 / InfluxAce / Grafana Champion
frankive
Service Provider
Posts: 1092
Liked: 134 times
Joined: May 14, 2013 8:35 pm
Full Name: Frank Iversen
Location: Norway
Contact:

Re: Grafana Dashboard using the new RestAPI

Post by frankive » 1 person likes this post

That was a very good looking dashboard :)

@jorgedlcruz , Is it possible to use Grafana to integrate with VAC and VBR in the same way for a UNIFIED single pane of glass for all Veeam related jobs?
Mike Resseler
Product Manager
Posts: 8191
Liked: 1322 times
Joined: Feb 08, 2013 3:08 pm
Full Name: Mike Resseler
Location: Belgium
Contact:

Re: Grafana Dashboard using the new RestAPI

Post by Mike Resseler »

Hey @frankive I'm sure @jorgedlcruz will reply here, but what exactly are you looking for, so we understand it better. One single grafana dashboard that connects to the different solutions and merges data? Or a dashboard that will have multiple "pages" with information for each solution separately?
frankive
Service Provider
Posts: 1092
Liked: 134 times
Joined: May 14, 2013 8:35 pm
Full Name: Frank Iversen
Location: Norway
Contact:

Re: Grafana Dashboard using the new RestAPI

Post by frankive »

We always look for the best way to get an overview of all of our backup jobs, regarding its VAC og Azure backup.
It seems like Grafana really can make this great. Not sure whats the best approach regarding multiple pages for each solution VS one page with multiple sources.
For a monitor on the wall we can easy switch between tabs automatically with Chrome so different solutions in each tab would work nice.

As a MSP we have always tried to achive a monitor solution which covers all of our backup jobs in a Singel Pane of View on a wall-monitor.
jorgedlcruz
Veeam Software
Posts: 1493
Liked: 655 times
Joined: Jul 17, 2015 6:54 pm
Full Name: Jorge de la Cruz
Contact:

Re: Grafana Dashboard using the new RestAPI

Post by jorgedlcruz »

Hello Frank,
The short answer is, yes this is possible, as within the years I have wrote different scripts to parse from all Veeam RESTFul API, and from there save it into "tables" to InfluxDB, last step from there is show them in Grafana, something like this:
Image

Can you create a simple Dashboard for a specific Customer you are offering him: VBO, VBA, and VBR? YES, I was building something like this:
Image

I am very close to having all Veeam products into a single Dashboard, for some specific cases like the ones you are mentioning, but all of this work is in my free time, for fun, and as you can guess, not officially supported. All the work is on VeeamHub - https://github.com/VeeamHub/grafana and it is MIT licensed, so feel free to grab it, edit it, make it better.

Ideas and feedback are all welcome.
Jorge de la Cruz
Senior Product Manager | Veeam ONE @ Veeam Software

@jorgedlcruz
https://www.jorgedelacruz.es / https://jorgedelacruz.uk
vExpert 2014-2024 / InfluxAce / Grafana Champion
frankive
Service Provider
Posts: 1092
Liked: 134 times
Joined: May 14, 2013 8:35 pm
Full Name: Frank Iversen
Location: Norway
Contact:

Re: Grafana Dashboard using the new RestAPI

Post by frankive »

This is just a fantastic piece of work!

Veeam should include this out-of-the-box for us backup operators which does not have the skill for scripting.. :)
jorgedlcruz
Veeam Software
Posts: 1493
Liked: 655 times
Joined: Jul 17, 2015 6:54 pm
Full Name: Jorge de la Cruz
Contact:

Re: Grafana Dashboard using the new RestAPI

Post by jorgedlcruz »

Hi Frank,
Well, Veeam does in fact include the RESTful API by default in almost all the products, and all that years of work of saving that into a DB are already available, on Grafana, which is 100% visual, you can just take what you want and show it in different places, etc. It is just a matter of pick what it is more important, an example of a query:
Image

I get your point though, but I tend to like Veeam giving the REST API, and everyone building, and integrating on their workflows, either with Grafana, Elastic, Graylog, Splunk, etc. :)
Jorge de la Cruz
Senior Product Manager | Veeam ONE @ Veeam Software

@jorgedlcruz
https://www.jorgedelacruz.es / https://jorgedelacruz.uk
vExpert 2014-2024 / InfluxAce / Grafana Champion
frankive
Service Provider
Posts: 1092
Liked: 134 times
Joined: May 14, 2013 8:35 pm
Full Name: Frank Iversen
Location: Norway
Contact:

Re: Grafana Dashboard using the new RestAPI

Post by frankive »

Hi.
I have setup telegraf and influx and can successfully query the local pi system in Grafana.
We have a Veeam Office 365 server with enabled restful api which I can browse trough https://veeam365server:4443/swagger

I have downloaded your script for Veeam Office 365 and configured it, but when i try to run it i get this errro, any clue?
https://imgur.com/a/zUGrpPu
jorgedlcruz
Veeam Software
Posts: 1493
Liked: 655 times
Joined: Jul 17, 2015 6:54 pm
Full Name: Jorge de la Cruz
Contact:

Re: Grafana Dashboard using the new RestAPI

Post by jorgedlcruz »

Hello Frank,
Yes, please install jq.
With a simple sudo apt-get install jq - or - yum install jq if you have CentOS. Let me know
Jorge de la Cruz
Senior Product Manager | Veeam ONE @ Veeam Software

@jorgedlcruz
https://www.jorgedelacruz.es / https://jorgedelacruz.uk
vExpert 2014-2024 / InfluxAce / Grafana Champion
frankive
Service Provider
Posts: 1092
Liked: 134 times
Joined: May 14, 2013 8:35 pm
Full Name: Frank Iversen
Location: Norway
Contact:

Re: Grafana Dashboard using the new RestAPI

Post by frankive »

yup, i actually found it on this page a few seconds later.. :)
https://serbaserbi-os.blogspot.com/2019 ... ry-pi.html
frankive
Service Provider
Posts: 1092
Liked: 134 times
Joined: May 14, 2013 8:35 pm
Full Name: Frank Iversen
Location: Norway
Contact:

Re: Grafana Dashboard using the new RestAPI

Post by frankive »

How long does it take to download all the data with the script? i have a demo enviroment with 5 organization and 5 backup jobs.
been running for an hour (manual start), still it misses 1 backup jobb, and the "licensed users" does not correspond with the licensed users in Veeam 365 itself.
jorgedlcruz
Veeam Software
Posts: 1493
Liked: 655 times
Joined: Jul 17, 2015 6:54 pm
Full Name: Jorge de la Cruz
Contact:

Re: Grafana Dashboard using the new RestAPI

Post by jorgedlcruz »

Hi Frank,
It does depend of the content in the line 232, you have 1000, then it will look for the last 1000 backup sessions, you can tune that later and reduce it. You can play with the time at the top, and put something like last 7 days or something, you should start seeing data. If you have teams, message me jorge.delacruzATveeamDOTcom
Jorge de la Cruz
Senior Product Manager | Veeam ONE @ Veeam Software

@jorgedlcruz
https://www.jorgedelacruz.es / https://jorgedelacruz.uk
vExpert 2014-2024 / InfluxAce / Grafana Champion
TropicOasis
Novice
Posts: 4
Liked: 1 time
Joined: Nov 16, 2020 4:49 pm
Full Name: Adam Chalmers
Contact:

Re: Grafana Dashboard using the new RestAPI

Post by TropicOasis »

Can someone help me with my Grafana dashboard for Veeam Enterprise Manager? I'm at a loss as to how to get this to work.

1. I have the configuration section of the veeam_enterprisemanager.sh file filled out correctly (I think)
2. I put it in the /opt directory of a Linux server
3. I did the chmod command to make it executable
4. I added it to my crontab

Do I need to have this run on the same server that has influxDB installed? I'm unsure what I'm doing here but Jorge's instructions seem very straight forward and are easy to follow. I don't think I should be having this much trouble creating the dashboard. Feel free to contact me to set up a quick Webex or Zoom meeting. Thanks in advance.

Adam
achalme4@ford.com
mbonamigo
Novice
Posts: 7
Liked: never
Joined: Aug 27, 2020 11:26 am
Full Name: Marciel Bonamigo
Contact:

Re: Grafana Dashboard using the new RestAPI

Post by mbonamigo »

It would be interesting to have the time of the last backup on the dashboard, as I have already seen cases of agents that the server was off and the message success was presented, however when looking at the time the last backup was from many days ago.
mbonamigo
Novice
Posts: 7
Liked: never
Joined: Aug 27, 2020 11:26 am
Full Name: Marciel Bonamigo
Contact:

Re: Grafana Dashboard using the new RestAPI

Post by mbonamigo »

does the script veeam_availability-console-grafana.sh work for v4?

If there is anything for Veeam service provider console v4

[root@svxoracle01 ~]# sh veeam_availability-console-grafana.sh
HTTP/1.1 400 Bad Request
Content-Type: application/json
Request-Id: 81b1bb18-5cc0-11eb-87f3-02001701b10c
X-Influxdb-Build: OSS
X-Influxdb-Error: unable to parse 'veeam_vac_vcclicense,edition=,status=,type=,contactPerson=,backupServerName=,companyName= licenseExpirationDate=1611284400,supportExpirationDate=1611284400,licensedCloudConnectBackups=,usedCloudConnectBackups=,licensedCloudConnectReplicas=,usedCloudConnectReplicas=,licensedCloudConnectServers=,usedCloudConnectServers=,licensedCloudConnectWorkstations=,usedCloudConnectWorkstations=': missing tag value
X-Influxdb-Version: 1.8.3
X-Request-Id: 81b1bb18-5cc0-11eb-87f3-02001701b10c
Date: Fri, 22 Jan 2021 14:45:44 GMT
Content-Length: 433
jorgedlcruz
Veeam Software
Posts: 1493
Liked: 655 times
Joined: Jul 17, 2015 6:54 pm
Full Name: Jorge de la Cruz
Contact:

Re: Grafana Dashboard using the new RestAPI

Post by jorgedlcruz »

mbonamigo wrote: Jan 22, 2021 12:22 pm It would be interesting to have the time of the last backup on the dashboard, as I have already seen cases of agents that the server was off and the message success was presented, however when looking at the time the last backup was from many days ago.
Hello,
Thank you for the message, are we discussing the Dashboard for the Veeam Backup for Azure? The last backup are included as dots, and as a table as well, are we referring to the same Dashboard?

Thank you
Jorge de la Cruz
Senior Product Manager | Veeam ONE @ Veeam Software

@jorgedlcruz
https://www.jorgedelacruz.es / https://jorgedelacruz.uk
vExpert 2014-2024 / InfluxAce / Grafana Champion
jorgedlcruz
Veeam Software
Posts: 1493
Liked: 655 times
Joined: Jul 17, 2015 6:54 pm
Full Name: Jorge de la Cruz
Contact:

Re: Grafana Dashboard using the new RestAPI

Post by jorgedlcruz »

mbonamigo wrote: Jan 22, 2021 2:50 pm does the script veeam_availability-console-grafana.sh work for v4?

If there is anything for Veeam service provider console v4

[root@svxoracle01 ~]# sh veeam_availability-console-grafana.sh
HTTP/1.1 400 Bad Request
Content-Type: application/json
Request-Id: 81b1bb18-5cc0-11eb-87f3-02001701b10c
X-Influxdb-Build: OSS
X-Influxdb-Error: unable to parse 'veeam_vac_vcclicense,edition=,status=,type=,contactPerson=,backupServerName=,companyName= licenseExpirationDate=1611284400,supportExpirationDate=1611284400,licensedCloudConnectBackups=,usedCloudConnectBackups=,licensedCloudConnectReplicas=,usedCloudConnectReplicas=,licensedCloudConnectServers=,usedCloudConnectServers=,licensedCloudConnectWorkstations=,usedCloudConnectWorkstations=': missing tag value
X-Influxdb-Version: 1.8.3
X-Request-Id: 81b1bb18-5cc0-11eb-87f3-02001701b10c
Date: Fri, 22 Jan 2021 14:45:44 GMT
Content-Length: 433
Hello,
I have not worked much on the Dashboard for the Veeam Service Provider Console v4, just made some small changes. I have been working on the new and upcoming VSPC v5, so when it will be released, I will make sure the sub-sequent group of Dashboards will be up to date.

Please remember this specific thread, and the sub-forum is for Veeam Backup for Azure.

Best regards
Jorge de la Cruz
Senior Product Manager | Veeam ONE @ Veeam Software

@jorgedlcruz
https://www.jorgedelacruz.es / https://jorgedelacruz.uk
vExpert 2014-2024 / InfluxAce / Grafana Champion
jorgedlcruz
Veeam Software
Posts: 1493
Liked: 655 times
Joined: Jul 17, 2015 6:54 pm
Full Name: Jorge de la Cruz
Contact:

Re: Grafana Dashboard using the new RestAPI

Post by jorgedlcruz » 1 person likes this post

Hello everyone,
I am glad to share the updated Grafana Dashboard, now ready for Veeam Backup for Azure v2, which is GA now :) Wanna take a quick look into how does it look like? Watch the following video So, the new version would look like something like this:
Image

As enhancements:
  • The map with Unprotected VMs now works perfectly!
  • New tables with all the needed details, including the new Backup Repo Tier, etc.
  • Makes uses of the new VBA Azure API v2, which is much faster
Download free from here - https://grafana.com/grafana/dashboards/12204

Feedback and ideas, all welcome!
Jorge de la Cruz
Senior Product Manager | Veeam ONE @ Veeam Software

@jorgedlcruz
https://www.jorgedelacruz.es / https://jorgedelacruz.uk
vExpert 2014-2024 / InfluxAce / Grafana Champion
jorgedlcruz
Veeam Software
Posts: 1493
Liked: 655 times
Joined: Jul 17, 2015 6:54 pm
Full Name: Jorge de la Cruz
Contact:

Re: Grafana Dashboard using the new RestAPI

Post by jorgedlcruz »

Hello everyone,
I didn't want to finish the year without a proper update regarding this open-source project. I am glad to share the updated Grafana Dashboard, now ready for Veeam Backup for Azure v3, which is GA since 29 of September 2021.

Image

As enhancements for the Dashboard:
  • The map with Unprotected VMs now has been updated to use the latest Grafana Map technology
  • All the queries have transitioned to InfluxDB v2.x + Flux
  • Legacy panels have transitioned to modern Grafana 8.x panels
  • Updated tables with all the needed details, including the new Backup Repo Tier, etc.
  • Added the SQL logic into Data Protection Policies, and protected resources
Download free from here - https://grafana.com/grafana/dashboards/12204

Feedback and ideas, all welcome!
Jorge de la Cruz
Senior Product Manager | Veeam ONE @ Veeam Software

@jorgedlcruz
https://www.jorgedelacruz.es / https://jorgedelacruz.uk
vExpert 2014-2024 / InfluxAce / Grafana Champion
Post Reply

Who is online

Users browsing this forum: No registered users and 5 guests