Hello
To determine the base load of a storage system generated by a virtual infrastructure, we are looking for a report which is able to draw a graph or report based on all child objects.
Let me give you an example:
You got 3 datastores
You got a different base load and different peak moments on all datastores.
Is there a way to create a report/graph which will offer me a consolidated/summarized view across all datastores?
I don't look for a report like:
datastore1 100 write I/Os
datastore2 350 write I/Os
datastore3 175 write I/Os
The report should look like this:
Datacenter1 625 write I/Os
Best regards
Patrick
-
PatrickS1
- Influencer
- Posts: 10
- Liked: 1 time
- Joined: Sep 21, 2012 4:54 pm
- Full Name: Patrick
- Contact:
-
Vitaliy S.
- VP, Product Management
- Posts: 27938
- Liked: 3020 times
- Joined: Mar 30, 2009 9:13 am
- Full Name: Vitaliy Safarov
- Contact:
Re: Multiple child objects as summarized graph/report
Hello Patrick,
Could you please tell me how would you use this data once you generate the report?
Thank you!
Could you please tell me how would you use this data once you generate the report?
Thank you!
-
PatrickS1
- Influencer
- Posts: 10
- Liked: 1 time
- Joined: Sep 21, 2012 4:54 pm
- Full Name: Patrick
- Contact:
Re: Multiple child objects as summarized graph/report
At the moment I need to check every graph for each VM or datastore to analyze the IOPS.
To determine an average load for an array I have to sum up all numbers from all datastores or VMs and I also have to check if (peak) loads happened at the same time.
If I would simply add all numbers without checking if the load/peak happened at the same time, the data/numbers would be wrong.
What we would love to see is a kind of stacked graph for all VMs or datastores.
This would tell us that our datacenter needs avg. xxx IOPS and we got peak loads of round about xxxx IOPS.
This numbers would help to size the backend properly.
At the moment it looks like this:
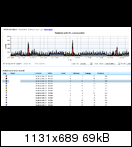
One stacked graph would help to get a much better overview.
Regards
Patrick
-
Vitaliy S.
- VP, Product Management
- Posts: 27938
- Liked: 3020 times
- Joined: Mar 30, 2009 9:13 am
- Full Name: Vitaliy Safarov
- Contact:
Re: Multiple child objects as summarized graph/report
Ok, got it! Thank you for clarifications. Currently there is no report that would show you stacked graph, but I will put this request into our FT tracking system. Thanks for the feedback!
-
PatrickS1
- Influencer
- Posts: 10
- Liked: 1 time
- Joined: Sep 21, 2012 4:54 pm
- Full Name: Patrick
- Contact:
Re: Multiple child objects as summarized graph/report
Good morning,
Yesterday I did my first storage analyses based on Veeam ONE data and I maybe need to correct myself.
Actually the graphs provided by Veeam ONE are a kind of stacked graph.
I just realized that the graphs represent already the maximum value across all selected objects.
So let’s say you got 3 objects selected and each generates 300 IOPS, then the graph scales up to 900 in total. If I mouse over the graph Veeam will tell me the actual value for the single object.
Kinds regards
Patrick
-
Vitaliy S.
- VP, Product Management
- Posts: 27938
- Liked: 3020 times
- Joined: Mar 30, 2009 9:13 am
- Full Name: Vitaliy Safarov
- Contact:
Re: Multiple child objects as summarized graph/report
Yes, you got it right. We do use stacked graphs in Monitor Client to show datastore load, however if you take a look a the reports it will give an average number for the selected datastore.
-
aporter
- Influencer
- Posts: 11
- Liked: 1 time
- Joined: May 18, 2012 2:44 am
- Full Name: Andrew Porter
- Contact:
Re: Multiple child objects as summarized graph/report
I am also interested in an easier way to report on total IOPs across multiple objects over time. I'm new to Veeam ONE, so it took me a while to find the Veeam ONE Monitor Datastores stacked disk IO report, but am surprised that there doesn't seem to be a way to export or save this data other than taking a screenshot.
I looked for a way to generate a similar report via Veeam ONE Reporter, but so far have only found reports that require you to choose a single datastore object.
So, to summarize here are the feature requests:
1. Provide totals for the latest, average, min and max values on stacked graphs
2. Provide a way to export or print a report of what you are actually seeing on the screen in Veeam ONE Monitor
3. Add support for stacking and totaling data points in Veeam ONE Reporter
Thanks,
Andrew
-
Vitaliy S.
- VP, Product Management
- Posts: 27938
- Liked: 3020 times
- Joined: Mar 30, 2009 9:13 am
- Full Name: Vitaliy Safarov
- Contact:
Re: Multiple child objects as summarized graph/report
Hi Andrew, thanks for the feedback!
Who is online
Users browsing this forum: No registered users and 23 guests