Hello
Is there any Ability to add the Summary pie charts from Veeam Backup & Replication,
Business View and / or the Virtual Infrastructure views as a dashboard widget in the native or in the webclient??
Monitor UI client does not provide many possibilities for customization, while Web UI does not have such pie charts so far.
Could you please clarify your use case for our better understanding?
Hello, i want to display the Business View pie charts and the Backup Infrastructure pie charts from the Summary View at the same time. This way I can see the status of the systems at a glance, as shown in the picture in the previous attachment. At the moment, the only solution I can think of is to start and display two clients. see also Case #07010257
Hello,
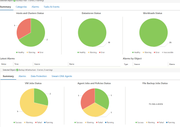
I have been working a bit with current widgets, so on a new dashboard you can create something similar to this:
Backup Job status is similar to the second image you showed us, grouped by day - This does not support Business view
Object Status Overview, this is similar to your first image, meaning alarms per virtual infrastructure object. This does support Business view, it is not a pie but you will see the status of the elements
Protected VMs Overview. This does support Business View, and it will show you if VMs are protected according to your RPO
On some other cases, you can get some of these charts out of SQL stored procedures, but in this case these are a blend of C# etc and it is not that trivial.
We are working on adding this visibility as widgets in the future, so it will be a bit more flexible. But meanwhile, hope that information is enough.
Thank you!
Jorge de la Cruz
Senior Director Observability & AI Product Management | Veeam ONE @ Veeam Software