-
Cragdoo
- Veeam Software
- Posts: 636
- Liked: 251 times
- Joined: Sep 27, 2011 12:17 pm
- Full Name: Craig Dalrymple
- Location: Scotland
- Contact:
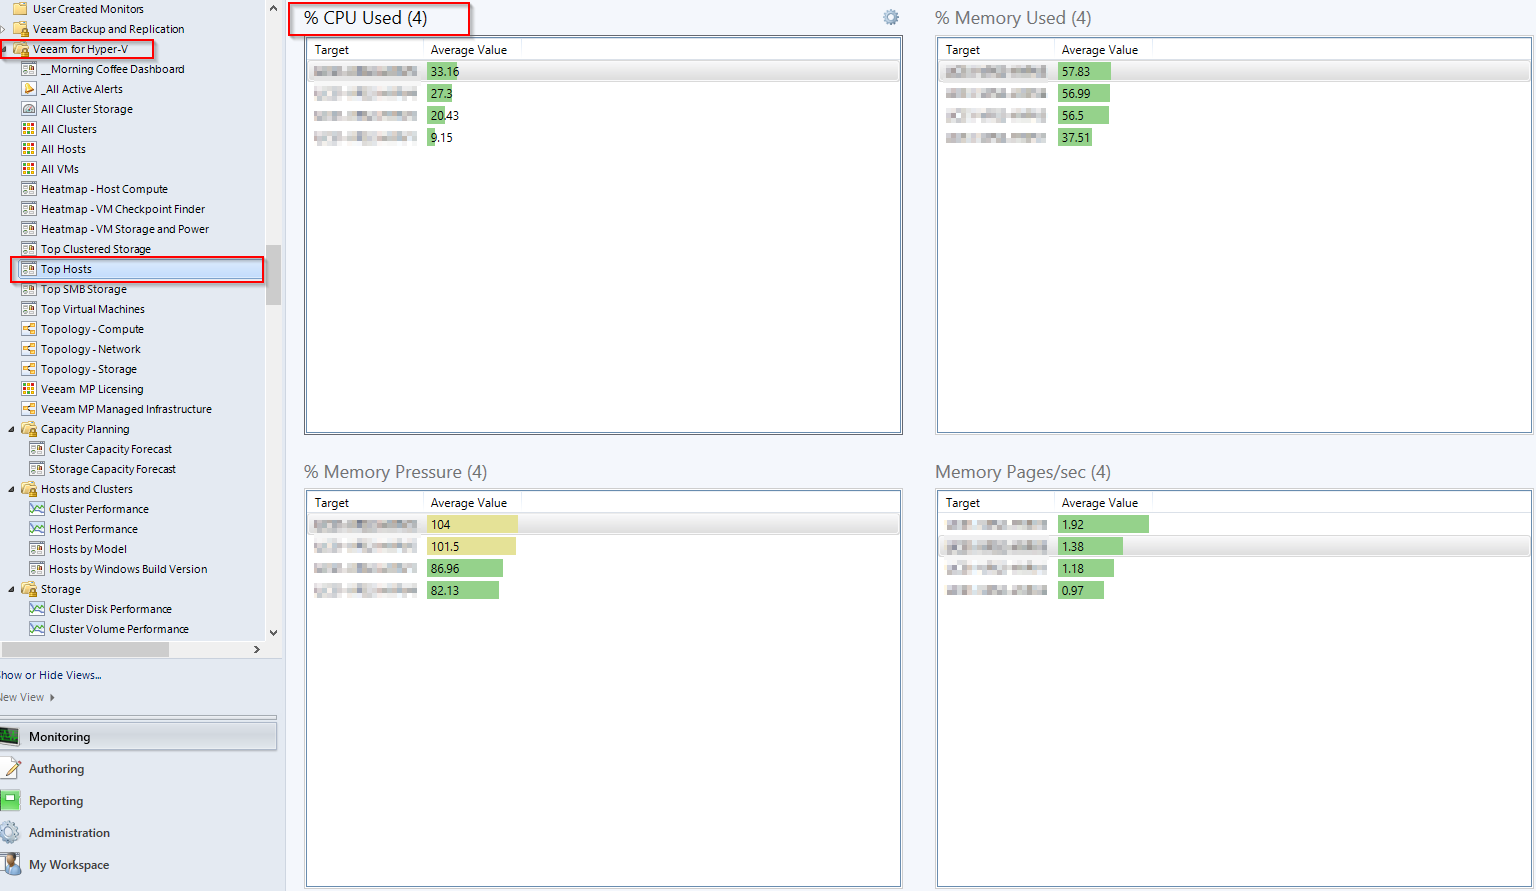
HyperV- Top Host - %CPU used
I would like to create a stand alone dashboard/graph for the above metric , so we can see the past trends. Is it possible to share the actual monitor value ?
-
Alec King
- VP, Product Management
- Posts: 1636
- Liked: 441 times
- Joined: Jan 01, 2006 1:01 am
- Location: Prague, CZ
- Contact:
Re: HyperV- Top Host - %CPU used
Hey Craig,
If you open the Host Compute Analysis dashboard from the Navigation pane, you will see recent (24 hours) history of this metric.
And you can also open generic Performance View (while in-context) and see the detailed counter history. And of course we have reports too...
We used the Microsoft naming convention for the counters where possible, and this one is called -
Object: Hyper-V Hypervisor Logical Processor
Counter: % Total Run Time
Instance: _Total
Any other questions, let us know!
Cheers
Alec
-
Cragdoo
- Veeam Software
- Posts: 636
- Liked: 251 times
- Joined: Sep 27, 2011 12:17 pm
- Full Name: Craig Dalrymple
- Location: Scotland
- Contact:
Re: HyperV- Top Host - %CPU used
excellent , thanks Alec
Who is online
Users browsing this forum: No registered users and 1 guest