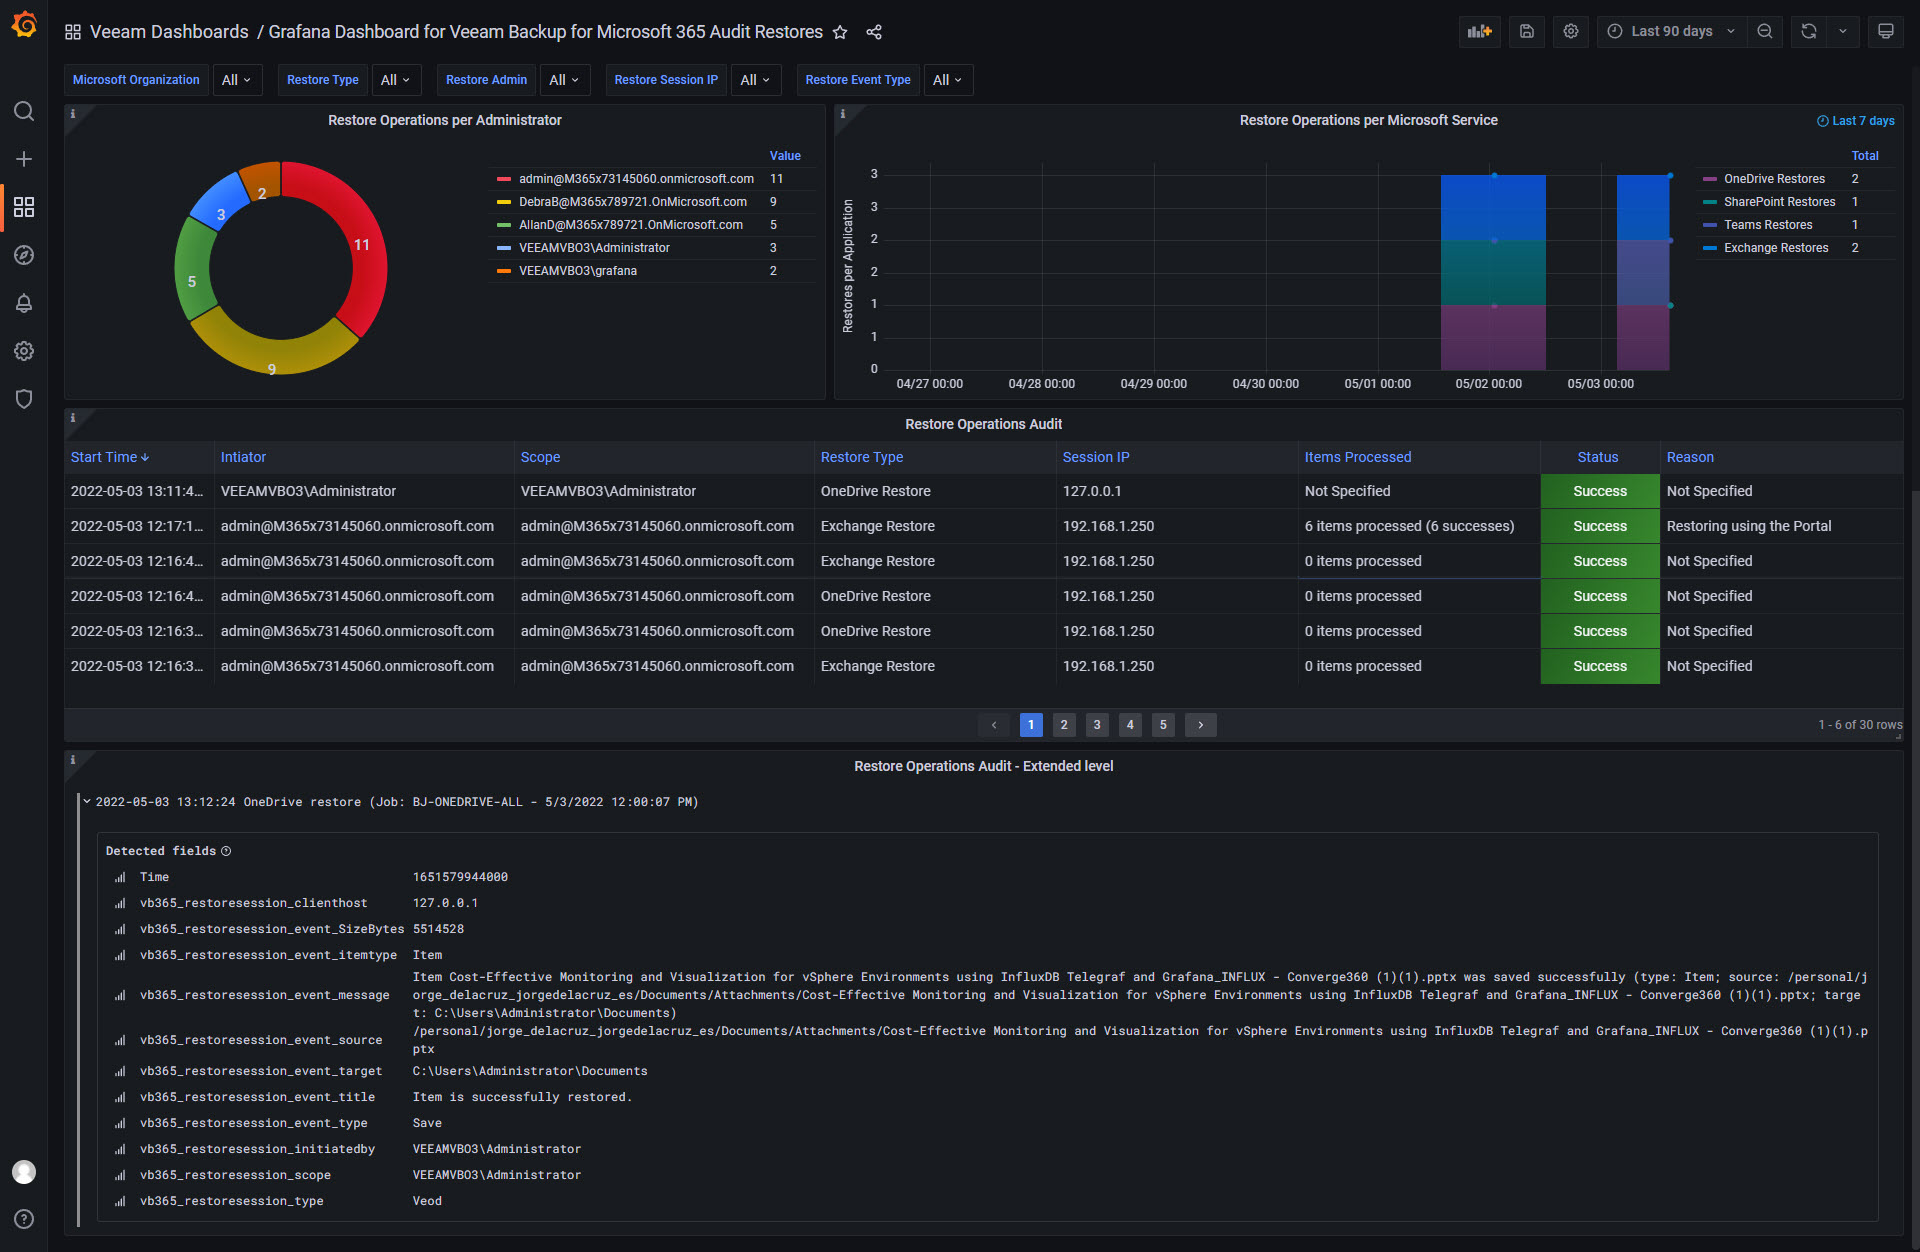
For years, Veeam Backup for Microsoft 365 Restore Audit has been and still is, an important topic. The native product has a ton of functionality already built-in, like deep-visibility on Restore Sessions on the GUI, SMTP real-time alerting per every Restore Operation, PowerShell, etc.
In VB365 v6, I've noticed that the RestoreSessions/{restoreSessionId}/Events/ included a ton of new information, and it has finally all the required data to grab it, and send it somewhere else, for example, an Observability tool like Grafana, Splunk, Elastic, etc.
I have created, Community based, of course, my usual bash shell script that sends that to InfluxDB, so we can visualize it later using Grafana, find more information here: Dark mode

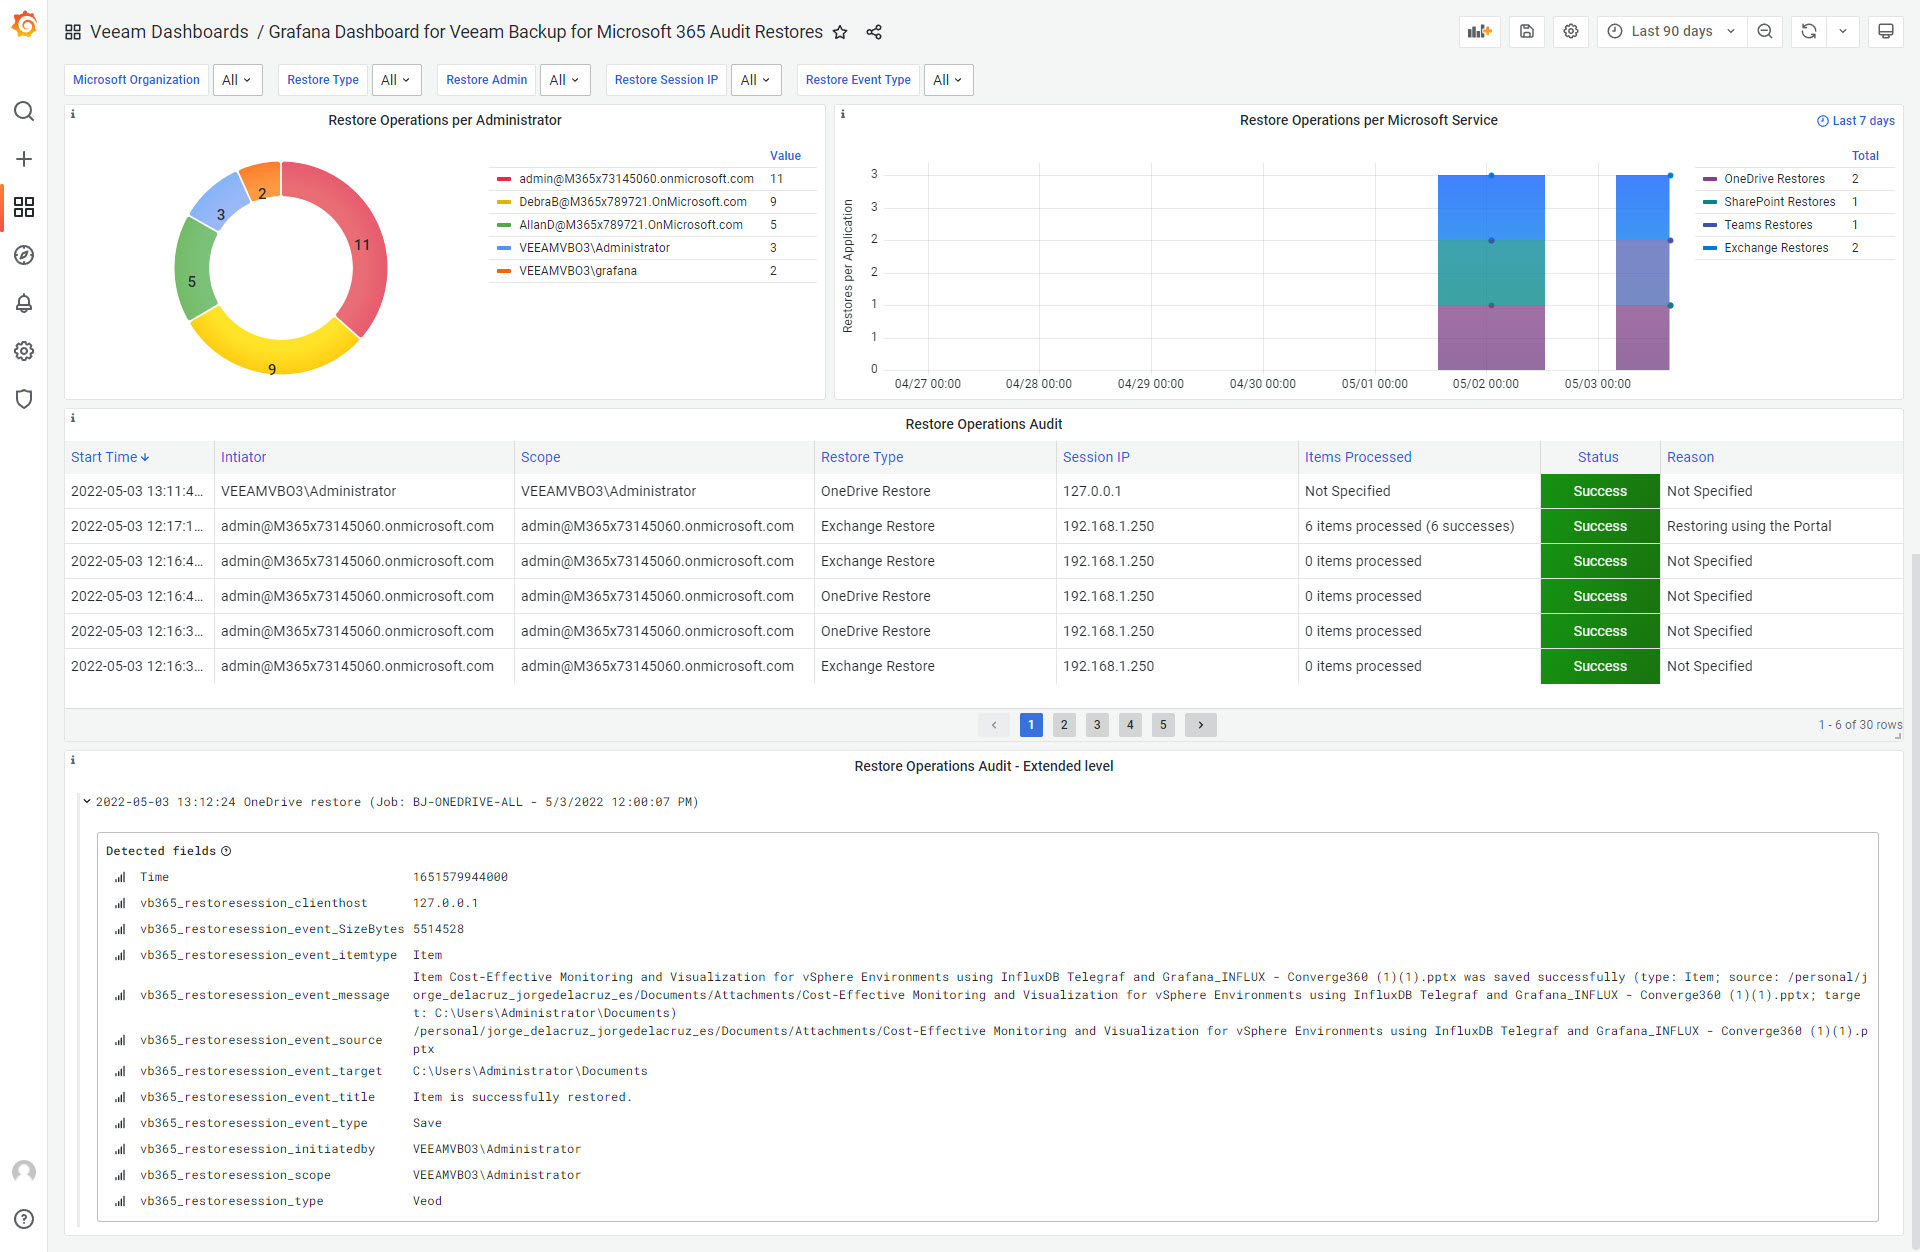
Light mode

Dashboard – Summary
- Restore Operations per Operator – A pie-chart that displays the different Operators, it can be even users restoring their own stuff using Restore Portal. It does display a comfortable table at the right with the most operations operator at the top.
- Restore Operations per Microsoft Service (Widget on the right) – A time-series table that displays just the last week, you can edit this of course, with a total of restore operations, with different colors per Microsoft 365 Service, remember that at the moment we can recover: Exchange Online, SharePoint Online, OneDrive for Business, or Microsoft Teams.
- Restore Operations Audit (Mid-table) - Now we jump into the Audit Mode, on this very first table, we can quickly see the high-level restore sessions per Operator, with some information like timestamp, who initiated the restore, scope in case it is a Restore Operator, Restore Type, IP, etc.
- Restore Operations Audit - Extended level (Bottom-table) - And we end with a really detailed Log-view, where we can expand every restore session, and take a look at what happened inside, it will include all the details we mentioned before, like whom did the operation, IP, etc. But it will also dig deep into the level of restoration that happened.
Hope this is useful.