-
Cragdoo
- Veeam Software
- Posts: 636
- Liked: 251 times
- Joined: Sep 27, 2011 12:17 pm
- Full Name: Craig Dalrymple
- Location: Scotland
- Contact:
VM disk latency metrics
I'm new to the management pack, but my first metric I looked at was VM disk latency, and I noticed there is no way to split this down to read and/or write latency ...am I missing something ? Or is the disk latency just an overview of a combined read/write metric ?
-
Cragdoo
- Veeam Software
- Posts: 636
- Liked: 251 times
- Joined: Sep 27, 2011 12:17 pm
- Full Name: Craig Dalrymple
- Location: Scotland
- Contact:
Re: VM disk latency metrics
So it would appear the metrics should be there
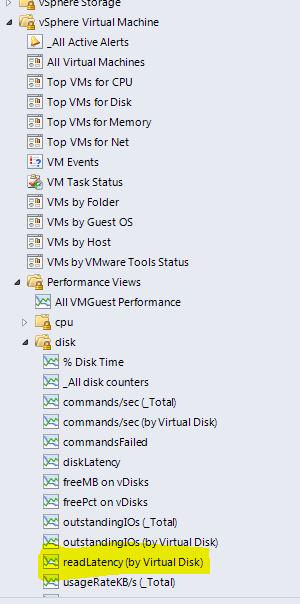
but I don't appear to have the metric in my SCOM console
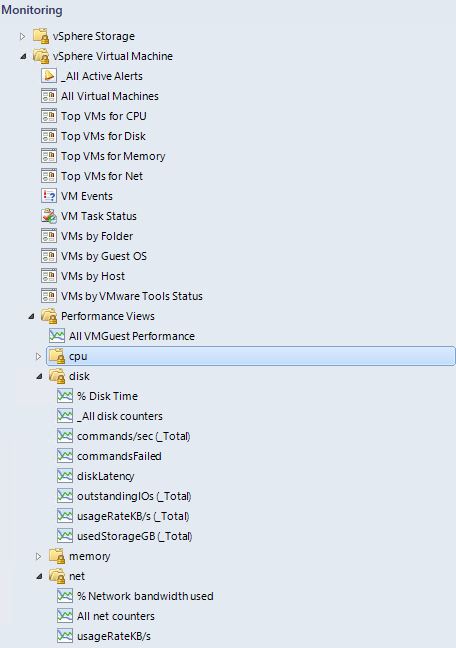
any suggestions ??

but I don't appear to have the metric in my SCOM console

any suggestions ??
-
sergey.g
- Veteran
- Posts: 452
- Liked: 76 times
- Joined: May 02, 2012 1:49 pm
- Full Name: Sergey Goncharenko
- Contact:
Re: VM disk latency metrics
Hi,
Vm DiskLatency metric is a direct metric we get from vSphere, here is you can see it in Vi Client.

And the reason you do not see a separate Read Latency metric is because in our latest R2 update for Veeam Management Pack v7, we've moved several less-frequently used metrics into a ResourceKit, we've done this to reduce the footprint of our Management Pack in SCOM databases and improve overall performance and scalability of our MP.
The Managment Pack in Resource Kit is called High-Granularity MP, if you want to get this metric back, you will need to import this MP and put VMs for which you want this metric into a special group.
You can find details there.
Let me know if you have any other questions regarding High-Granularity MP or the way we obtain metrics for vSphere targets.
Thanks.
Vm DiskLatency metric is a direct metric we get from vSphere, here is you can see it in Vi Client.

And the reason you do not see a separate Read Latency metric is because in our latest R2 update for Veeam Management Pack v7, we've moved several less-frequently used metrics into a ResourceKit, we've done this to reduce the footprint of our Management Pack in SCOM databases and improve overall performance and scalability of our MP.
The Managment Pack in Resource Kit is called High-Granularity MP, if you want to get this metric back, you will need to import this MP and put VMs for which you want this metric into a special group.
You can find details there.
Let me know if you have any other questions regarding High-Granularity MP or the way we obtain metrics for vSphere targets.
Thanks.
-
Cragdoo
- Veeam Software
- Posts: 636
- Liked: 251 times
- Joined: Sep 27, 2011 12:17 pm
- Full Name: Craig Dalrymple
- Location: Scotland
- Contact:
Re: VM disk latency metrics
sergey
I have enabled the MP and added my test cluster to the Group as detailed in the article, but I do still seem to be missing read/write latency metrics.
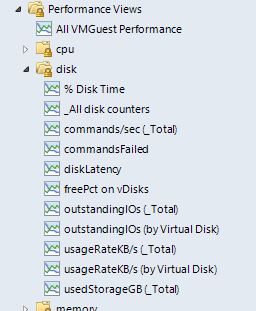
Looking at the details of the high granularity pack it would appear the read/write latencies are not included
I have enabled the MP and added my test cluster to the Group as detailed in the article, but I do still seem to be missing read/write latency metrics.

Looking at the details of the high granularity pack it would appear the read/write latencies are not included
- VMGuest-disk freePct Disk partition name
VMGuest-disk outstandingIOs (sum readOIO and writeOIO) Datastore name:Virtual disk name
VMGuest-disk usageRateKB/s (sum read + write rate) Datastore name:Virtual disk name
-
sergey.g
- Veteran
- Posts: 452
- Liked: 76 times
- Joined: May 02, 2012 1:49 pm
- Full Name: Sergey Goncharenko
- Contact:
Re: VM disk latency metrics
Hi,
Sorry about such a confusion. You are correct that these read and write latency mentrics are not in the HG MP, they are in the core MP, but in R2 we are collecting them to the Data Warehouse DB only (to save some space in the Ops DB). You should be able to see these metrics in both Performance History Reports and in Dashboard Widgets, for example in the Performance View Widget. I've created an example MP with Dashboard which displays Read and Write latency for VMs.
Hope this helps. Please, accept my appologies for the initial confusion about metrics being available in R2.
Thanks.
Who is online
Users browsing this forum: No registered users and 1 guest