Host-based backup of VMware vSphere VMs.
Post Reply
pinkerton
Enthusiast
Posts: 82
Liked: 4 times
Joined: Sep 29, 2011 9:57 am
Contact:

Slow Active Fulls on Veeam 9.5 with Server 2016 and ReFS

Post by pinkerton »

Dear Forums,

in February we moved our Backup and Replication server from version 8.0 on an HP DL360G7 with Windows Server 2008 R2 to version 9.5 on an HP DL360Gen9 and Windows Server 2016. We are backing up machines from VMware 6.0 U2 using Direct SAN access and Reserved Incrementals and are writing the backup files as per-vm backup files to a local ReFS formatted drive directly attached to the Veeam server via Fibre Channel. The ReFS formatted drive is based on a volume in an HP MSA2040 storage array that is dedicated to the Veeam server only.

To stay safe, we are running Active Fulls for every job each Saturday. Our problem is that the Active Fulls sometimes (and it seems to get worse from week to week now) runs very slowy so meanwhile we have to cancel the backup. At first we thought that the slow backup speed is solved by a reboot of the server and therefore might be caused by a yet unknown driver problem in Windows Server 2016 i.e., however, last Saturday we rebooted the server before the start of the Active Full backup and it sill ran very slowly.

The total size of our primary backup job is 18.5TB and actually contains about 11TB data. When the Active Full is running as expected, the backup takes about 8 hours to complete:

Image

As mentioned above, it is getting worse and now we have backup times from over 60 hours and have to cancel the job before completion:

Image

Some technical specifications of the environment:

- 1 Veeam Backup and Replication 9.5 U1 server based on Windows Server 2016
- Server has 16 cores, 32GB RAM and one Backup Proxy with 12 concurrent tasks
- 3 Backup Repositores which all together are using 10 concurrent tasks
- Backup Repositories are all per-vm based and reside on one local drive
- The local drive resides on a HP MSA2040 FC array dedicated for Veeam
- FC speed is 8gb/s, the mentioned drive consists of 48x 1.2TB SAS 10k drives
- Data source is a HP 3PAR 8200 with VMs residing on 64x 1.2TB SAS 10k drives

In case the Active Full for the above mentioned job with 11TB is completed within 8 hours we are experiencing a speed of roughly 385MB/s which is what we expect. In the case of 60 hours, we are down to roughly 50 MB/s which is way to slow and even slower than it was with Veeam 8.0 on the old server which wrote the backups to an even slower HP P2000 G3 with only 12 4TB 7.2K SATA drives!

It is also unlikely that the problem comes from the 3PAR since this would mean that the load on 3PAR would exist for the 60 hours as well which is not the case. There is also not that much load on the SAN switches for 60 hours. When running a Veeam Zip right now, speed is just fine so currently we cannot reproduce the behaviour when we want to. We however have not tested this during the backup window when the backup is actually running.

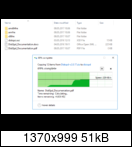
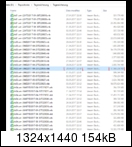
In addition to that I'm wondering why the restore assistant shows the full backups with a timestamp from Friday and not Saturday. The VBK files also have a time stamp from Fridays where however no full backup is run at all:
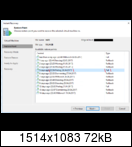
Image

Image

We have also opened a support case on this with ticket ID 02146161 but it currently seems that the logs do not show any indication of a problem related to Veeam. Therefore I wanted to share it on the forums as well. Any help is highly appreciated!

Thanks
Michael
Delo123
Veteran
Posts: 361
Liked: 109 times
Joined: Dec 28, 2012 5:20 pm
Full Name: Guido Meijers
Contact:

Re: Slow Active Fulls on Veeam 9.5 with Server 2016 and ReFS

Post by Delo123 » 2 people like this post

Just by looking at your specs I would say you definitely need more Ram for ReFS to work without hiccups. 32Gb isn't very much, especially with reFS metadata mapping. To have a look maybe you should download RAMMap from Sysinternals and have a look at the numbers. The other option, of course, would be to cramp the system full with RAM ;) I've seen some other Forum members also benefiting much from more RAM with these kinds of issues.
pinkerton
Enthusiast
Posts: 82
Liked: 4 times
Joined: Sep 29, 2011 9:57 am
Contact:

Re: Slow Active Fulls on Veeam 9.5 with Server 2016 and ReFS

Post by pinkerton »

Dear Forums,

Veeam Support is still working on this but I have some additional information that I would like to share as well. Last Friday, we have moved the Active Full from Saturday to Sunday to see whether performance would be better when running the Active Full on another day. This showed no difference and performance was as bad as when running the backup on Saturday. I therefore had to cancel the backup this morning.

While the backup was still running, Veeam reported a speed of only 15/MBs with the target storage being the bottleneck and I noticed that the volume was indeed extremely slow. I barely could extract files from within a 2MB ZIP file to the volume with only a 250KB/s:

Image

Image

Veeam Support asked us to perform a disk benchmark of the target volume using Microsoft Disk Speed. While I could not run the benchmark at the same time the backup was running, with about 650MB/s the benchmark results were as expected just after stopping the backup job:

Code: Select all

D:\diskspd\amd64fre>diskspd.exe -c1G -b512K -w67 -r64K -h -d600 d:\testfile.dat
WARNING: Complete CPU utilization cannot currently be gathered within DISKSPD for this system.
         Use alternate mechanisms to gather this data such as perfmon/logman.
         Active KGroups 2 > 1 and/or processor count 128 > 64.

Command Line: diskspd.exe -c1G -b512K -w67 -r64K -h -d600 d:\testfile.dat

Input parameters:

        timespan:   1
        -------------
        duration: 600s
        warm up time: 5s
        cool down time: 0s
        random seed: 0
        path: 'd:\testfile.dat'
                think time: 0ms
                burst size: 0
                software cache disabled
                hardware write cache disabled, writethrough on
                performing mix test (read/write ratio: 33/67)
                block size: 524288
                using random I/O (alignment: 65536)
                number of outstanding I/O operations: 2
                thread stride size: 0
                threads per file: 1
                using I/O Completion Ports
                IO priority: normal


Results for timespan 1:
*******************************************************************************

actual test time:       600.00s
thread count:           1
proc count:             128

CPU |  Usage |  User  |  Kernel |  Idle
-------------------------------------------
   0|   4.22%|   0.14%|    4.08%|  95.78%
   1|   0.25%|   0.14%|    0.10%|  99.75%
   2|   0.87%|   0.68%|    0.18%|  99.13%
   3|   0.93%|   0.90%|    0.03%|  99.07%
   4|   0.30%|   0.23%|    0.07%|  99.70%
   5|   0.21%|   0.15%|    0.06%|  99.80%
   6|   0.30%|   0.11%|    0.20%|  99.70%
   7|   0.25%|   0.16%|    0.10%|  99.75%
   8|   0.29%|   0.19%|    0.10%|  99.71%
   9|   0.16%|   0.09%|    0.07%|  99.85%
  10|   0.59%|   0.32%|    0.27%|  99.41%
  11|   6.72%|   1.01%|    5.71%|  93.28%
  12|   0.60%|   0.12%|    0.48%|  99.40%
  13|   0.10%|   0.04%|    0.06%|  99.90%
  14|   0.34%|   0.15%|    0.18%|  99.67%
  15|   0.11%|   0.07%|    0.04%|  99.89%
  16|   0.00%|   0.00%|    0.00%|   0.00%
  17|   0.00%|   0.00%|    0.00%|   0.00%
  18|   0.00%|   0.00%|    0.00%|   0.00%
  19|   0.00%|   0.00%|    0.00%|   0.00%
  20|   0.00%|   0.00%|    0.00%|   0.00%
  21|   0.00%|   0.00%|    0.00%|   0.00%
  22|   0.00%|   0.00%|    0.00%|   0.00%
  23|   0.00%|   0.00%|    0.00%|   0.00%
  24|   0.00%|   0.00%|    0.00%|   0.00%
  25|   0.00%|   0.00%|    0.00%|   0.00%
  26|   0.00%|   0.00%|    0.00%|   0.00%
  27|   0.00%|   0.00%|    0.00%|   0.00%
  28|   0.00%|   0.00%|    0.00%|   0.00%
  29|   0.00%|   0.00%|    0.00%|   0.00%
  30|   0.00%|   0.00%|    0.00%|   0.00%
  31|   0.00%|   0.00%|    0.00%|   0.00%
  32|   0.00%|   0.00%|    0.00%|   0.00%
  33|   0.00%|   0.00%|    0.00%|   0.00%
  34|   0.00%|   0.00%|    0.00%|   0.00%
  35|   0.00%|   0.00%|    0.00%|   0.00%
  36|   0.00%|   0.00%|    0.00%|   0.00%
  37|   0.00%|   0.00%|    0.00%|   0.00%
  38|   0.00%|   0.00%|    0.00%|   0.00%
  39|   0.00%|   0.00%|    0.00%|   0.00%
  40|   0.00%|   0.00%|    0.00%|   0.00%
  41|   0.00%|   0.00%|    0.00%|   0.00%
  42|   0.00%|   0.00%|    0.00%|   0.00%
  43|   0.00%|   0.00%|    0.00%|   0.00%
  44|   0.00%|   0.00%|    0.00%|   0.00%
  45|   0.00%|   0.00%|    0.00%|   0.00%
  46|   0.00%|   0.00%|    0.00%|   0.00%
  47|   0.00%|   0.00%|    0.00%|   0.00%
  48|   0.00%|   0.00%|    0.00%|   0.00%
  49|   0.00%|   0.00%|    0.00%|   0.00%
  50|   0.00%|   0.00%|    0.00%|   0.00%
  51|   0.00%|   0.00%|    0.00%|   0.00%
  52|   0.00%|   0.00%|    0.00%|   0.00%
  53|   0.00%|   0.00%|    0.00%|   0.00%
  54|   0.00%|   0.00%|    0.00%|   0.00%
  55|   0.00%|   0.00%|    0.00%|   0.00%
  56|   0.00%|   0.00%|    0.00%|   0.00%
  57|   0.00%|   0.00%|    0.00%|   0.00%
  58|   0.00%|   0.00%|    0.00%|   0.00%
  59|   0.00%|   0.00%|    0.00%|   0.00%
  60|   0.00%|   0.00%|    0.00%|   0.00%
  61|   0.00%|   0.00%|    0.00%|   0.00%
  62|   0.00%|   0.00%|    0.00%|   0.00%
  63|   0.00%|   0.00%|    0.00%|   0.00%
  64|   0.00%|   0.00%|    0.00%|   0.00%
  65|   0.00%|   0.00%|    0.00%|   0.00%
  66|   0.00%|   0.00%|    0.00%|   0.00%
  67|   0.00%|   0.00%|    0.00%|   0.00%
  68|   0.00%|   0.00%|    0.00%|   0.00%
  69|   0.00%|   0.00%|    0.00%|   0.00%
  70|   0.00%|   0.00%|    0.00%|   0.00%
  71|   0.00%|   0.00%|    0.00%|   0.00%
  72|   0.00%|   0.00%|    0.00%|   0.00%
  73|   0.00%|   0.00%|    0.00%|   0.00%
  74|   0.00%|   0.00%|    0.00%|   0.00%
  75|   0.00%|   0.00%|    0.00%|   0.00%
  76|   0.00%|   0.00%|    0.00%|   0.00%
  77|   0.00%|   0.00%|    0.00%|   0.00%
  78|   0.00%|   0.00%|    0.00%|   0.00%
  79|   0.00%|   0.00%|    0.00%|   0.00%
  80|   0.00%|   0.00%|    0.00%|   0.00%
  81|   0.00%|   0.00%|    0.00%|   0.00%
  82|   0.00%|   0.00%|    0.00%|   0.00%
  83|   0.00%|   0.00%|    0.00%|   0.00%
  84|   0.00%|   0.00%|    0.00%|   0.00%
  85|   0.00%|   0.00%|    0.00%|   0.00%
  86|   0.00%|   0.00%|    0.00%|   0.00%
  87|   0.00%|   0.00%|    0.00%|   0.00%
  88|   0.00%|   0.00%|    0.00%|   0.00%
  89|   0.00%|   0.00%|    0.00%|   0.00%
  90|   0.00%|   0.00%|    0.00%|   0.00%
  91|   0.00%|   0.00%|    0.00%|   0.00%
  92|   0.00%|   0.00%|    0.00%|   0.00%
  93|   0.00%|   0.00%|    0.00%|   0.00%
  94|   0.00%|   0.00%|    0.00%|   0.00%
  95|   0.00%|   0.00%|    0.00%|   0.00%
  96|   0.00%|   0.00%|    0.00%|   0.00%
  97|   0.00%|   0.00%|    0.00%|   0.00%
  98|   0.00%|   0.00%|    0.00%|   0.00%
  99|   0.00%|   0.00%|    0.00%|   0.00%
 100|   0.00%|   0.00%|    0.00%|   0.00%
 101|   0.00%|   0.00%|    0.00%|   0.00%
 102|   0.00%|   0.00%|    0.00%|   0.00%
 103|   0.00%|   0.00%|    0.00%|   0.00%
 104|   0.00%|   0.00%|    0.00%|   0.00%
 105|   0.00%|   0.00%|    0.00%|   0.00%
 106|   0.00%|   0.00%|    0.00%|   0.00%
 107|   0.00%|   0.00%|    0.00%|   0.00%
 108|   0.00%|   0.00%|    0.00%|   0.00%
 109|   0.00%|   0.00%|    0.00%|   0.00%
 110|   0.00%|   0.00%|    0.00%|   0.00%
 111|   0.00%|   0.00%|    0.00%|   0.00%
 112|   0.00%|   0.00%|    0.00%|   0.00%
 113|   0.00%|   0.00%|    0.00%|   0.00%
 114|   0.00%|   0.00%|    0.00%|   0.00%
 115|   0.00%|   0.00%|    0.00%|   0.00%
 116|   0.00%|   0.00%|    0.00%|   0.00%
 117|   0.00%|   0.00%|    0.00%|   0.00%
 118|   0.00%|   0.00%|    0.00%|   0.00%
 119|   0.00%|   0.00%|    0.00%|   0.00%
 120|   0.00%|   0.00%|    0.00%|   0.00%
 121|   0.00%|   0.00%|    0.00%|   0.00%
 122|   0.00%|   0.00%|    0.00%|   0.00%
 123|   0.00%|   0.00%|    0.00%|   0.00%
 124|   0.00%|   0.00%|    0.00%|   0.00%
 125|   0.00%|   0.00%|    0.00%|   0.00%
 126|   0.00%|   0.00%|    0.00%|   0.00%
 127|   0.00%|   0.00%|    0.00%|   0.00%
-------------------------------------------
avg.|   0.13%|   0.04%|    0.09%|  12.37%

Total IO
thread |       bytes     |     I/Os     |     MB/s   |  I/O per s |  file
------------------------------------------------------------------------------
     0 |    394022879232 |       751539 |     626.28 |    1252.55 | d:\testfile.dat (1024MB)
------------------------------------------------------------------------------
total:      394022879232 |       751539 |     626.28 |    1252.55

Read IO
thread |       bytes     |     I/Os     |     MB/s   |  I/O per s |  file
------------------------------------------------------------------------------
     0 |    130231042048 |       248396 |     206.99 |     413.99 | d:\testfile.dat (1024MB)
------------------------------------------------------------------------------
total:      130231042048 |       248396 |     206.99 |     413.99

Write IO
thread |       bytes     |     I/Os     |     MB/s   |  I/O per s |  file
------------------------------------------------------------------------------
     0 |    263791837184 |       503143 |     419.28 |     838.56 | d:\testfile.dat (1024MB)
------------------------------------------------------------------------------
total:      263791837184 |       503143 |     419.28 |     838.56

D:\diskspd\amd64fre>
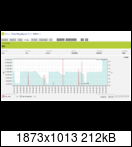
This was also reflected in the performance data of the target storage:

Image

Support is still analyzing the results.

Thanks,
Michael
pinkerton
Enthusiast
Posts: 82
Liked: 4 times
Joined: Sep 29, 2011 9:57 am
Contact:

Re: Slow Active Fulls on Veeam 9.5 with Server 2016 and ReFS

Post by pinkerton »

Delo123 wrote:Just by looking at your specs I would say you definitely need more Ram for ReFS to work without hiccups. 32Gb isn't very much, especially with reFS metadata mapping. To have a look maybe you should download RAMMap from Sysinternals and have a look at the numbers. The other option, of course, would be to cramp the system full with RAM ;) I've seen some other Forum members also benefiting much from more RAM with these kinds of issues.
Thanks for the hint, I will have a look at this!

/edit: Just checked this and it seems enough RAM was available during the backups:

Image

The peaks in RAM usage do not correlate with the times the active fulls were run.
Delo123
Veteran
Posts: 361
Liked: 109 times
Joined: Dec 28, 2012 5:20 pm
Full Name: Guido Meijers
Contact:

Re: Slow Active Fulls on Veeam 9.5 with Server 2016 and ReFS

Post by Delo123 »

Yes, as said some other forum members report similar things.

Ps. regarding your Target... A 1GB Testfile would easily fit in your controller's cache so personally it wouldn't trust it a bit... But this seems to be a cpu load thing (as said maybe caused by memory) so yeah, have a look there...
Also have a look at concurrent job settings (maybe too much is running in parallel)

Pps. have a look here: veeam-backup-replication-f2/refs-4k-hor ... 9-285.html
It includes this post from Gostev reagrding 3 possible reg settings to test (option 1 to try first), it's probably good to have a good look at the posts in this thread.
Gostev wrote:
All, here is the official KB article from Microsoft >FIX: Heavy memory usage in ReFS on Windows Server 2016 and Windows 10 https://support.microsoft.com/en-us/hel ... windows-10
Please don't forget to install KB4013429 https://support.microsoft.com/en-us/hel ... -kb4013429 before applying the registry values, and remember to reboot the server after doing so.
Delo123
Veteran
Posts: 361
Liked: 109 times
Joined: Dec 28, 2012 5:20 pm
Full Name: Guido Meijers
Contact:

Re: Slow Active Fulls on Veeam 9.5 with Server 2016 and ReFS

Post by Delo123 »

pinkerton wrote: Thanks for the hint, I will have a look at this!
/edit: Just checked this and it seems enough RAM was available during the backups:
Image
The peaks in RAM usage do not correlate with the times the active fulls were run.
You sure that's Ram? Isn't that free diskspace on D: ? Anyway, i wouldn't trust veeam one here but really let RAMMap during these backups and have a look at the metadata size...
pinkerton
Enthusiast
Posts: 82
Liked: 4 times
Joined: Sep 29, 2011 9:57 am
Contact:

Re: Slow Active Fulls on Veeam 9.5 with Server 2016 and ReFS

Post by pinkerton » 1 person likes this post

Delo123 wrote: You sure that's Ram? Isn't that free diskspace on D: ? Anyway, i wouldn't trust veeam one here but really let RAMMap during these backups and have a look at the metadata size...
Sorry, picked the wrong sensor. Just noticed that there wasn't one set up for RAM :mrgreen: Going to have a look at the information you provided, thanks a lot!
pinkerton
Enthusiast
Posts: 82
Liked: 4 times
Joined: Sep 29, 2011 9:57 am
Contact:

Re: Slow Active Fulls on Veeam 9.5 with Server 2016 and ReFS

Post by pinkerton »

Just performed a little test and started the backup. While it started with good performance, speed dropped a few minutes later. So was the amount of available RAM. However, free RAM increased a little later but performance remained slow:

Image
Delo123
Veteran
Posts: 361
Liked: 109 times
Joined: Dec 28, 2012 5:20 pm
Full Name: Guido Meijers
Contact:

Re: Slow Active Fulls on Veeam 9.5 with Server 2016 and ReFS

Post by Delo123 » 2 people like this post

Have a good look (and read) at page 12 of this topic! (and the cool Animation by EricJ) and the reg "fixes" discussed there... I'm afraid it's not simply as easy as watching memory realtime only...
veeam-backup-replication-f2/refs-4k-hor ... 9-165.html
pinkerton
Enthusiast
Posts: 82
Liked: 4 times
Joined: Sep 29, 2011 9:57 am
Contact:

Re: Slow Active Fulls on Veeam 9.5 with Server 2016 and ReFS

Post by pinkerton » 1 person likes this post

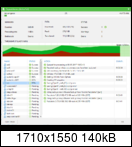
I have now upgraded the RAM from 32GB to 64GB and reduced the concurrent tasks for the job from 6 to 4. So far the active full backup is running stable and it even is faster than before, now reaching 1Gb/s :

Image

Usually, the jobs runs together with 3 other jobs and 12 concurrent tasks in total. We'll see what happens when everything is running alltogether but for now it seems that upgrading the RAM and reducing the slots helped.
Delo123
Veteran
Posts: 361
Liked: 109 times
Joined: Dec 28, 2012 5:20 pm
Full Name: Guido Meijers
Contact:

Re: Slow Active Fulls on Veeam 9.5 with Server 2016 and ReFS

Post by Delo123 »

12 concurrent tasks when a single 3Par can do over 300MB/s seems very much to me, maybe even overloading your fabric? Anyway, good numbers!
albertwt
Veteran
Posts: 942
Liked: 53 times
Joined: Nov 05, 2009 12:24 pm
Location: Sydney, NSW
Contact:

Re: Slow Active Fulls on Veeam 9.5 with Server 2016 and ReFS

Post by albertwt »

Delo123 wrote:Have a good look (and read) at page 12 of this topic! (and the cool Animation by EricJ) and the reg "fixes" discussed there... I'm afraid it's not simply as easy as watching memory realtime only...
veeam-backup-replication-f2/refs-4k-hor ... 9-165.html
Will this problem be fixed in the Update 2 next month?
--
/* Veeam software enthusiast user & supporter ! */
foggy
Veeam Software
Posts: 21139
Liked: 2141 times
Joined: Jul 11, 2011 10:22 am
Full Name: Alexander Fogelson
Contact:

Re: Slow Active Fulls on Veeam 9.5 with Server 2016 and ReFS

Post by foggy »

Albert, what specific Veeam B&R problem are you referring to?
Post Reply

Who is online

Users browsing this forum: Google [Bot], Semrush [Bot] and 23 guests