-
- Veeam Legend
- Posts: 229
- Liked: 37 times
- Joined: Nov 04, 2009 2:08 pm
- Contact:
Strange behavior in parallel processing - by design?
We are a Veeam partner and reseller and already switched several customers to V7 successfully.
Most of the time we see an increase in processing speed of at least 25% to a max. of 50%.
But on the most recent upgrade it was a decrease - so we studied the process there thoroughly:
It is a direct SAN access based proxy (which also is correctly used as SAN according to the log). The proxy has 8 cores (Xeon Westmere) at 2.8 GHz and should be able to cope with parallel processing.
Parallel processing is switched on, compression tuned to the new "optimal" setting and proxy and repository, which is locally attached array of 24 disks (!).
Running under V7 the job states to be proxy and sometimes network (!) limited. There should be no network traffic at all, as we read directly from SAN and write to a local disk.
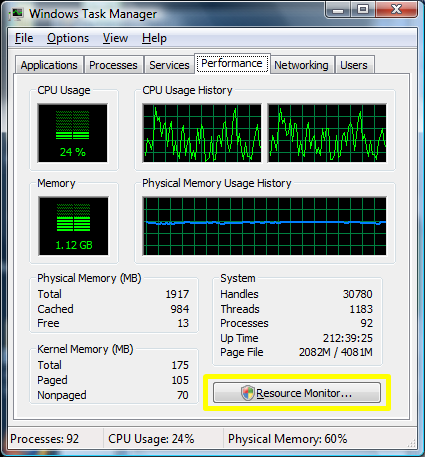
In the task manager one can see an almoust fully saturated network (1GBit) and a fully saturated CPU. Both we didn't expect.
When looking into Windows' ressource monitor during the backup, one can see 5 Veeam Agents.
One is listed as VeeamAgent64.EXE and four others are named VeeamAgent.EXE.
It seems only the VeeamAgant64.EXE is reveiving data via Netzwork but the four other agents send data via network (->ressource monitor).
Is this by design or is B&R here falsely routing the traffic out an in again?
Thanks for any ideas.
-
- VeeaMVP
- Posts: 6166
- Liked: 1971 times
- Joined: Jul 26, 2009 3:39 pm
- Full Name: Luca Dell'Oca
- Location: Varese, Italy
- Contact:
Re: Strange behavior in parallel processing - by design?
Check the cuncurrency limit of the proxy, it has happened to me too while upgrading, the old settings where giving us "green" until 4 cuncurrent jobs, while with the new v7 and the new processing algorithms you can increase the limit up to 8, 1 per core. With parallel processing then each processed vmdk is going to use 1 core, so you will be able to save 8 vmdk at the same time. The 4 veeamagent.exe sounds to me just like the limit of 4 cuncurrent jobs...
Also, change th compression settings from high to optimal, as stated into the user guide.
Luca.
Also, change th compression settings from high to optimal, as stated into the user guide.
Luca.
Luca Dell'Oca
Principal EMEA Cloud Architect @ Veeam Software
@dellock6
https://www.virtualtothecore.com/
vExpert 2011 -> 2022
Veeam VMCE #1
Principal EMEA Cloud Architect @ Veeam Software
@dellock6
https://www.virtualtothecore.com/
vExpert 2011 -> 2022
Veeam VMCE #1
-
- Veeam Legend
- Posts: 229
- Liked: 37 times
- Joined: Nov 04, 2009 2:08 pm
- Contact:
Re: Strange behavior in parallel processing - by design?
Luca.
Thanks for your reply. Concurrency limit of the proxy is currently set to four (intentionally). So I wouldn't expect to see 100% CPU.
Therefore 4 agents would be explainable. But why 5? And why do we see four of them sending via LAN while the 5th is only receiving.
The traffic seems to go out and back in on the same machine, as we have only this proxy and a locally attached repo. Strange.
We switched to the new "optimal" of course.
Regards, Michael
-
- Veteran
- Posts: 1531
- Liked: 226 times
- Joined: Jul 21, 2010 9:47 am
- Full Name: Chris Dearden
- Contact:
Re: Strange behavior in parallel processing - by design?
The 64 bit process is the repository side data mover. Have you got a multi homed server? It sounds like the services have bound to a different hostname (fqdn vs hostname for example) so traffic from the 32 bit source side threads is going over that NIC to the target side.
I have seen similar behaviour before, think we solved it with some hostfile and TCP/IP tweaking.
-
- VP, Product Management
- Posts: 6035
- Liked: 2860 times
- Joined: Jun 05, 2009 12:57 pm
- Full Name: Tom Sightler
- Contact:
Re: Strange behavior in parallel processing - by design?
From a process perspective, everything you see is completely expected. As you well know, there are at least two processes involved in every Veeam backup job a proxy and a repository. In V7 the repository agent is 64-bit (VeeamAgent64.exe), while the proxy side agent continues to be 32-bit (VeeamAgent.exe). Even when running on the same machine these components will still exist so for your case there's 4 proxy agent sending data to the repository agent, and the repository agent is receiving the data and writing it to disk.
Now, what is interesting is why you are seeing this traffic on the actual interface as this really shouldn't be happening since, while they are indeed network connections, they are internal to the machine. What tool are you using to measure this? What version of Windows? Is RSS enabled? Chris' suggestion of a dual-homed network is also a possible cause that I've seen.
-
- Veeam Legend
- Posts: 229
- Liked: 37 times
- Joined: Nov 04, 2009 2:08 pm
- Contact:
Re: Strange behavior in parallel processing - by design?
Thank you Chris and Tom for your replies.
I didn't know that the repo agent is 64bit now and that it's running only once for each repo, no matter how many proxies connect. So this answers the 1:4 ratio.
But still there should be no network traffic and I don't see any network traffic with other similar implementations.
The binding of the NIC sounds like a reasonable explanation. As far as I remember we have only a single NIC there - but I'll check that.
Also I see ~20% CPU load to the 64bit agent - and 20% to each of the 4 proxy agents. Why should the repo have CPU load?
I'm using Windows 2008 R2 built in resource monitor you can access from task manager:
In the network region you can have a list of the processes having the most incoming or outgoing traffic. Also in "Networking" within task manager I've seen 100% load to the 1Gbit NIC.
Thanks for the help.
Michael
-
- Veteran
- Posts: 1531
- Liked: 226 times
- Joined: Jul 21, 2010 9:47 am
- Full Name: Chris Dearden
- Contact:
Re: Strange behavior in parallel processing - by design?
The target side agent is responsible for dedupe of all the data from all of the source side agents.
-
- Novice
- Posts: 4
- Liked: never
- Joined: Jul 18, 2013 12:39 am
- Full Name: Steve Barry
- Contact:
Re: Strange behavior in parallel processing - by design?
I would like to bring this topic back up as I am seeing the exact same issue in my setup. We have direct SAN access (FC) via a physical proxy, and the repository is a SAN (FC) drive on the same proxy. And yet, the NIC of the proxy is seeing about 1 Gb of data transferred during backup jobs. I don't understand why this would be the case.
I have been having issues where our entire network is saturated during Veeam backups, so I'm not sure if this is related or just another weird behavior.
-
- VP, Product Management
- Posts: 27379
- Liked: 2800 times
- Joined: Mar 30, 2009 9:13 am
- Full Name: Vitaliy Safarov
- Contact:
Re: Strange behavior in parallel processing - by design?
How did you add your repository to the Veeam backup console? Is it an NTFS formatted LUN connected via FC to the Windows server?
-
- Novice
- Posts: 4
- Liked: never
- Joined: Jul 18, 2013 12:39 am
- Full Name: Steve Barry
- Contact:
Re: Strange behavior in parallel processing - by design?
Yes, that is correct. FC LUN presented to Windows server, formatted with NTFS.
I added the repository as a Windows Server and specified the path to the drive.
Vitaliy S. wrote:How did you add your repository to the Veeam backup console? Is it an NTFS formatted LUN connected via FC to the Windows server?
-
- VP, Product Management
- Posts: 27379
- Liked: 2800 times
- Joined: Mar 30, 2009 9:13 am
- Full Name: Vitaliy Safarov
- Contact:
Re: Strange behavior in parallel processing - by design?
With this kind of setup there shouldn't be much traffic going through the network. I would suggest reviewing backup job log just to make sure that correct proxy server and backup mode is selected. BTW, do you possibly see failover to network processing mode? Can you please disable this checkbox on the proxy server and confirm that direct SAN mode is used?
-
- Novice
- Posts: 4
- Liked: never
- Joined: Jul 18, 2013 12:39 am
- Full Name: Steve Barry
- Contact:
Re: Strange behavior in parallel processing - by design?
According to the GUI, everything is using SAN backup mode and the option to failover to nbd is disabled.
The logs also show that SAN access mode was used:
[09.12.2013 17:02:35] <01> Info [ProxyDetector] Detected san storage access level for proxy [xxxxxxxxxxxxxx] - [FullSan]
[09.12.2013 17:02:35] <01> Info [ProxyDetector] Detected mode [san] for proxy [xxxxxxxxxxxxxx]
The logs also show that SAN access mode was used:
[09.12.2013 17:02:35] <01> Info [ProxyDetector] Detected san storage access level for proxy [xxxxxxxxxxxxxx] - [FullSan]
[09.12.2013 17:02:35] <01> Info [ProxyDetector] Detected mode [san] for proxy [xxxxxxxxxxxxxx]
Vitaliy S. wrote:With this kind of setup there shouldn't be much traffic going through the network. I would suggest reviewing backup job log just to make sure that correct proxy server and backup mode is selected. BTW, do you possibly see failover to network processing mode? Can you please disable this checkbox on the proxy server and confirm that direct SAN mode is used?
-
- Chief Product Officer
- Posts: 31809
- Liked: 7301 times
- Joined: Jan 01, 2006 1:01 am
- Location: Baar, Switzerland
- Contact:
Re: Strange behavior in parallel processing - by design?
In that case, I have no explanation to what you are seeing, so it would be best to take this to support for closer investigation of your setup. The job most certainly should not be using network if backup proxy and backup repository is the same machine... this does not make any sense!
-
- Service Provider
- Posts: 182
- Liked: 48 times
- Joined: Sep 03, 2012 5:28 am
- Full Name: Yizhar Hurwitz
- Contact:
Re: Strange behavior in parallel processing - by design?
Hi.
How many CPU cores on the proxy server?
We can see only 2 cores in the Task Manager screenshot above which doesn't align with the 8 cores statement in the original question.
Yizhar
How many CPU cores on the proxy server?
We can see only 2 cores in the Task Manager screenshot above which doesn't align with the 8 cores statement in the original question.
Yizhar
-
- Expert
- Posts: 235
- Liked: 37 times
- Joined: Aug 06, 2013 10:40 am
- Full Name: Peter Jansen
- Contact:
Re: Strange behavior in parallel processing - by design?
Do you have any update on this? I am experiencing exactly the same behaviour on our physical proxys. It are 2 big physical machines (24core 96GB mem) that also have the repository attached by SAN (FC, dual ported 8Gbit HBA.). Network is 4x1Gbit teamed. It seems to be using the network for data transport or at least it is doing a lot with the network even if the backup should be definitely go san based only. (disabled failover to network). Bottleneckstats are showing network avg@85% and target most of the time @0%... Our storage is really highspeed enterprise class and there are no performance problems whatsoever on that side. I have tried various things but I cannot get it running as I expect it should run san based.steve.barry@lw.com wrote:I would like to bring this topic back up as I am seeing the exact same issue in my setup. We have direct SAN access (FC) via a physical proxy, and the repository is a SAN (FC) drive on the same proxy. And yet, the NIC of the proxy is seeing about 1 Gb of data transferred during backup jobs. I don't understand why this would be the case..
thanks, Peter
-
- Product Manager
- Posts: 20411
- Liked: 2300 times
- Joined: Oct 26, 2012 3:28 pm
- Full Name: Vladimir Eremin
- Contact:
Re: Strange behavior in parallel processing - by design?
Hi, Peter,
What about job session statistics? Are also seeing an indication that SAN mode is being used?
If so, kindly, open a case with our support team and let them investigate this behavior.
Thanks.
What about job session statistics? Are also seeing an indication that SAN mode is being used?
If so, kindly, open a case with our support team and let them investigate this behavior.
Thanks.
-
- Expert
- Posts: 235
- Liked: 37 times
- Joined: Aug 06, 2013 10:40 am
- Full Name: Peter Jansen
- Contact:
Re: Strange behavior in parallel processing - by design?
Hi Vladimir,
i am absolutely sure it uses SAN mode, it says so in job statistics. I also had disabled failover to network so the job should fail if SAN wasn't available. I will open a case for this.
Thanks, Peter
i am absolutely sure it uses SAN mode, it says so in job statistics. I also had disabled failover to network so the job should fail if SAN wasn't available. I will open a case for this.
Thanks, Peter
-
- Veteran
- Posts: 1531
- Liked: 226 times
- Joined: Jul 21, 2010 9:47 am
- Full Name: Chris Dearden
- Contact:
Re: Strange behavior in parallel processing - by design?
Hi Peter, are your proxy servers dual homed? I wonder if the source side and target side data movers are not connecting "locally".
-
- Expert
- Posts: 235
- Liked: 37 times
- Joined: Aug 06, 2013 10:40 am
- Full Name: Peter Jansen
- Contact:
Re: Strange behavior in parallel processing - by design?
Hi Chris,
the server has 4 nics teamed together. Only 1 ipaddress is used. I did another test. Bottleneck stats show that network is @95%, target@3%. Transfer speeds seems like almost a flatline for a 1 Gbps connection. (Appx 140MB/sec). I also see that when I take a look at resource monitor while backup is running. What looks like strange behaviour is that when I look at diskIO in resourcemon, IOrate flips al the time from 400MB/sec back to 10MB/sec, it's going up an down and up and down during the complete session.
As I said earlier, I will open a case for this (right after the short holiday brake I am enjoying at this moment
Bye, Peter
Who is online
Users browsing this forum: Bing [Bot], CoLa, d.artzen, Majestic-12 [Bot], ronnmartin61 and 315 guests